Visualization and Geo Mapping of Dengue Cases Using Time Series Forecasting
DOI:
https://doi.org/10.69478/BEST2025v1n2a028Keywords:
Dengue, Time Series Forecasting, Random Forest RegressorAbstract
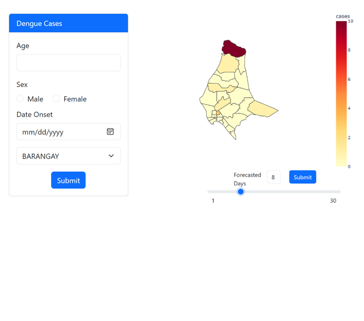
Accurate and timely reporting of dengue cases is essential for the Department of Health (DOH) and Municipal Health Office (MHO) to monitor and respond to outbreaks effectively to help track the spread of the disease and deploy resources where they are most needed. Strengthening surveillance system, ensures real time data collection and analysis, with enhanced epidemiological surveillance units, improving the monitoring of dengue trends and outbreaks. This study developed a system for Visualization and Geo Mapping of Dengue Cases using Time Series Forecasting. Time Series is a certain sequence of data observations that a system collects within specific periods of time (daily, monthly, or yearly). The aim of this study is to design an effective and user-friendly surveillance system that will accurately monitor and control the dengue outbreak in a timely manner. Time series forecasting models were usually used to predict high and low dengue incidence as accurate prediction may provide timely forewarnings, and predictions are made from historical data available. The forecasting feature of the system used time series algorithm to predict future dengue cases, specifically random forest regressor. The visual summary of information has been a great support in showing the concentration of the cases to help in determining high risk areas. With the addition of forecasting, it helped in detecting emerging infections and aid in the decision making and prompted the government unit responsible in taking actions for enhanced and strengthened public health efforts of the government.
References
R. Villanueva, “Philippines Logs 220,705 Dengue Cases in 2022,” The Philippine Star, January 2023, https://www.philstar.com/nation/2023/01/17/2238093/philippines-logs-220705-dengue-cases-2022.
R. Villanueva, “DOH Records 80% Hikes in Dengue Cases,” The Philippine Star, November 2024, https://www.philstar.com/nation/2024/11/24/2402577/doh-records-80-hike-dengue-cases.
B. C. Susbilla, “Dengue Cases in Antique Near 1K Mark,” Philippine Information Agency, June 2022, https://mirror.pia.gov.ph/news/2022/06/23/dengue-cases-in-antique-near-1k-mark.
L. Breiman, “Random Forests,” Machine Learning, vol. 45, October 2001, pp. 5-32, https://doi.org/10.1023/A:1010933404324.
T. M. Carvajal, K. M. Viacrusis, L.F.T. Hernandez, H. T. Ho, D. M. Amalin, K. Watanabe, “Machine Learning Methods Reveal the Temporal Pattern of Dengue Incidence Using Meteorological Factors in Metropolitan Manila, Philippines,” BMC Infectious Diseases, vol. 18, April 2018, https://doi.org/10.1186/s12879-018-3066-0.
N. Zhao, K. Charland, M. Carabali, E. O. Nsoesie, M. Maheu-Giroux, E. Rees, M. Yuan, C. Garcia Balaguera, G. Jaramillo Ramirez, K. Zinszer, “Machine Learning and Dengue Forecasting: Comparing Random Forests and Artificial Neural Networks for Predicting Dengue Burden at National and Sub-National Scales in Colombia,” PLoS Neglected Tropical Diseases, vol. 14, no. 9, September 2020, https://doi.org/10.1371/journal.pntd.0008056.
X. Chen, P. Moraga, “Assessing Dengue Forecasting Methods: A Comparative Study of Statistical Models and Machine Learning Techniques in Rio de Janeiro, Brazil” Tropical Medicine and Health, vol. 53, April 2025, https://doi.org/10.1186/s41182-025-00723-7.
Downloads
Published
Issue
Section
Categories
License
Copyright (c) 2025 Vera A. Panaguiton (Author)

This work is licensed under a Creative Commons Attribution-NonCommercial 4.0 International License.

